
Metrics for OpenSearch/Elasticsearch domains and S3 buckets now available in Cloud.gov logging system
The Cloud.gov team is excited to announce some new additions to the logging system that will allow customers to monitor their services more effectively:
- Comprehensive Elasticsearch/OpenSearch domain metrics to help teams monitor system performance and resource utilization for brokered domains
- A new metric that allows teams to easily track the size of their S3 buckets
Available S3 Metrics
Storage and Capacity Metrics
- Bucket Size in Bytes, metric_name:
BucketSizeBytes
Available OpenSearch/Elasticsearch Metrics
System Resource Metrics
CPU Utilization
These metrics help identify processing load and potential performance bottlenecks.
- Overall domain CPU usage, metric_name:
CPUUtilization - Master node CPU usage, metric_name:
MasterCPUUtilization
Memory Pressure
These metrics monitor memory consumption and other potential memory-related issues.
- JVM Memory Pressure, metric_name:
JVMMemoryPressure - Old Generation JVM Memory Pressure, metric_name:
OldGenJVMMemoryPressure - Master Node Memory Pressure, metric_name:
MasterJVMMemoryPressure - Old Generation Master Node Memory Pressure, metric_name:
MasterOldGenJVMMemoryPressure
Storage and Capacity Metrics
Free Storage Space
This metric helps track storage capacity and plan for scaling.
- Available storage in gigabytes, metric_name:
FreeStorageSpace
Threadpool Performance
Write Queue Metrics
- Write Queue Count, metric_name:
ThreadpoolWriteQueue - Write Queue Rejected Requests, metric_name:
ThreadpoolWriteRejected
Search Queue Metrics
These metrics monitor background processing and potential system overload:
- Search Queue Count, metric_name:
ThreadpoolSearchQueue - Search Queue Rejected Requests, metric_name:
ThreadpoolSearchRejected
Using the Services - S3 Dashboard
A quick way to view domain metrics is to:
- Log in to the logging system
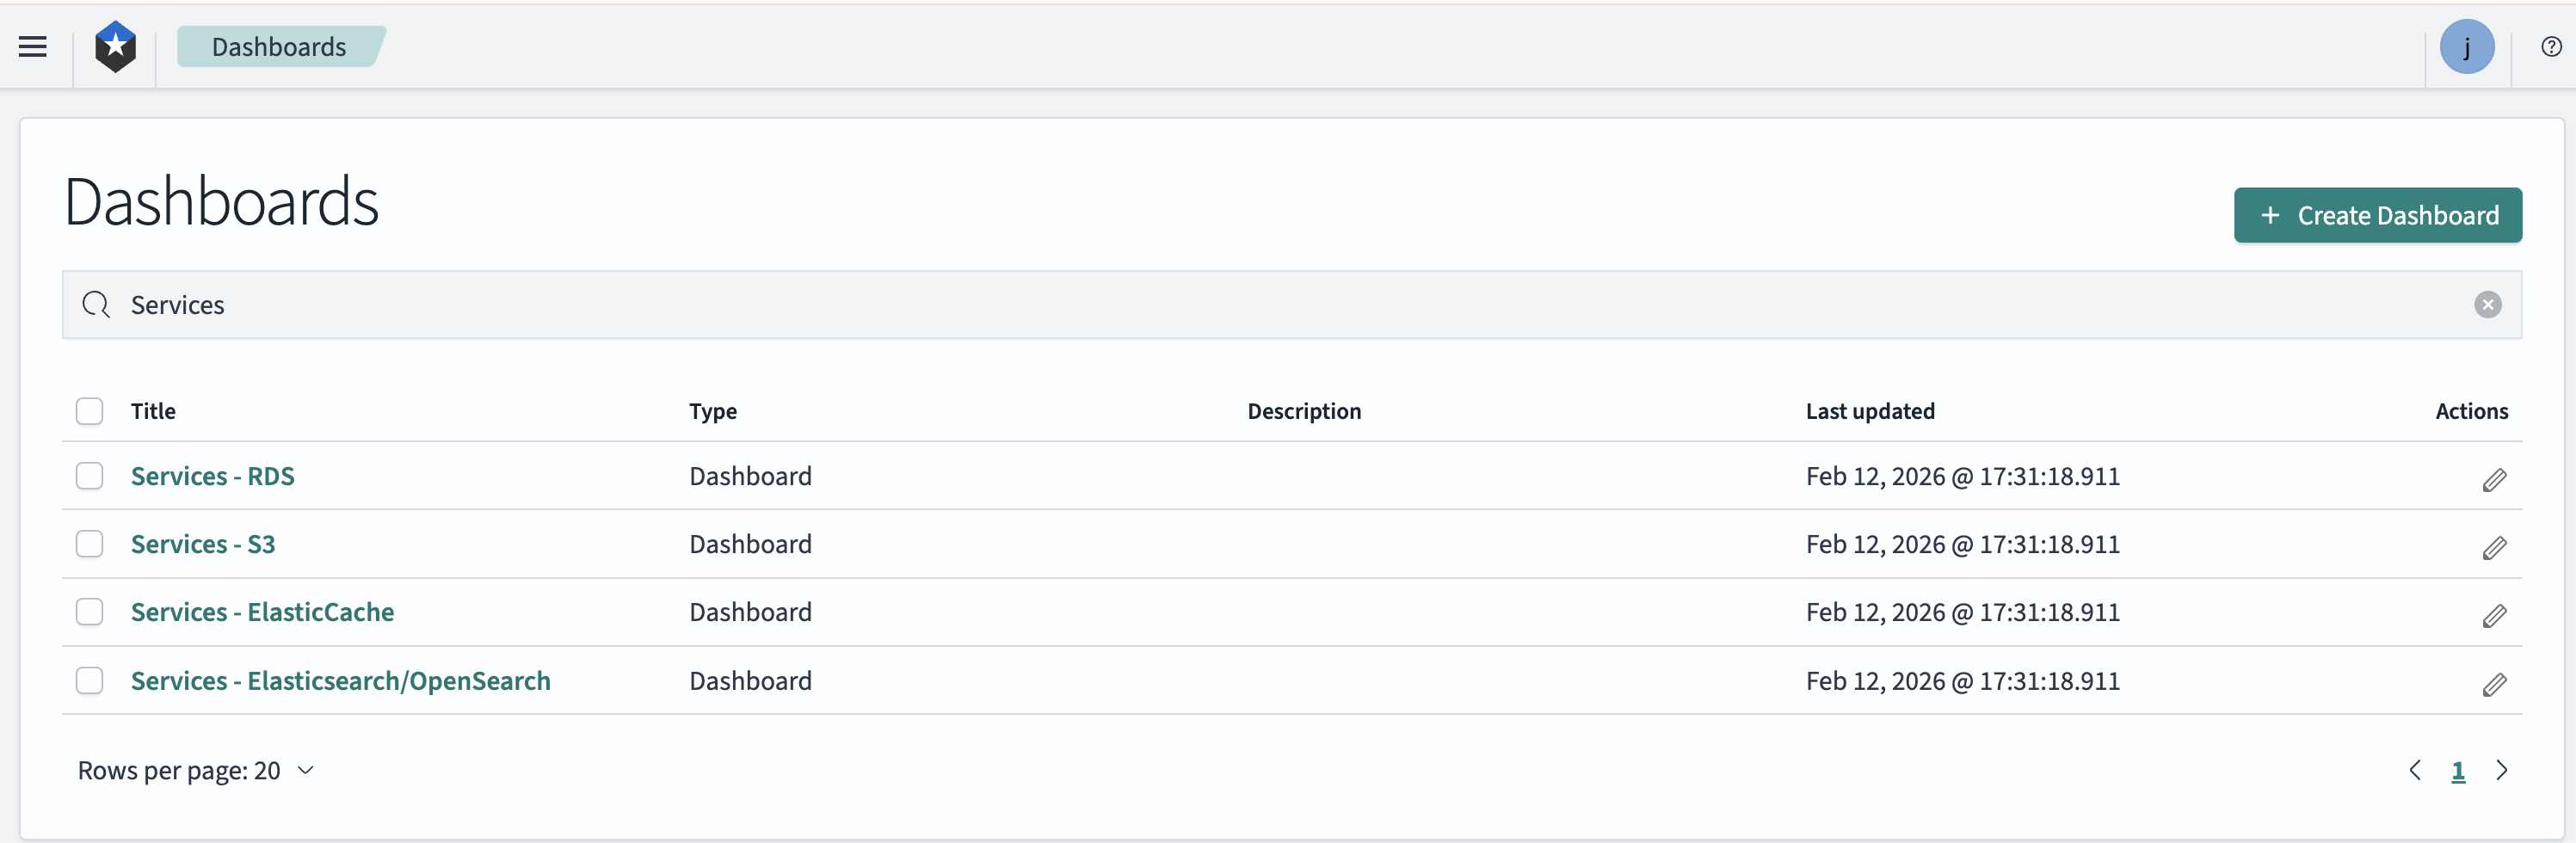
- Click on "Dashboards" in the left sidebar menu
- Enter "Services" in the search bar
- Follow the link for "Services - S3"
Using the Services - Elasticsearch/OpenSearch Dashboard
A quick way to view domain metrics is to:
- Log in to the logging system
- Click on "Dashboards" in the left sidebar menu
- Enter "Services" in the search bar
- Follow the link for "Services - Elasticsearch/OpenSearch"
How to Search Metrics in the Logging System
Metrics are ingested into the logging system with the value @type: metrics, which provides an easy way to filter them.
To find your metrics in the logging system:
- Log in to the logging system
- Click on "Discover" in the left sidebar menu
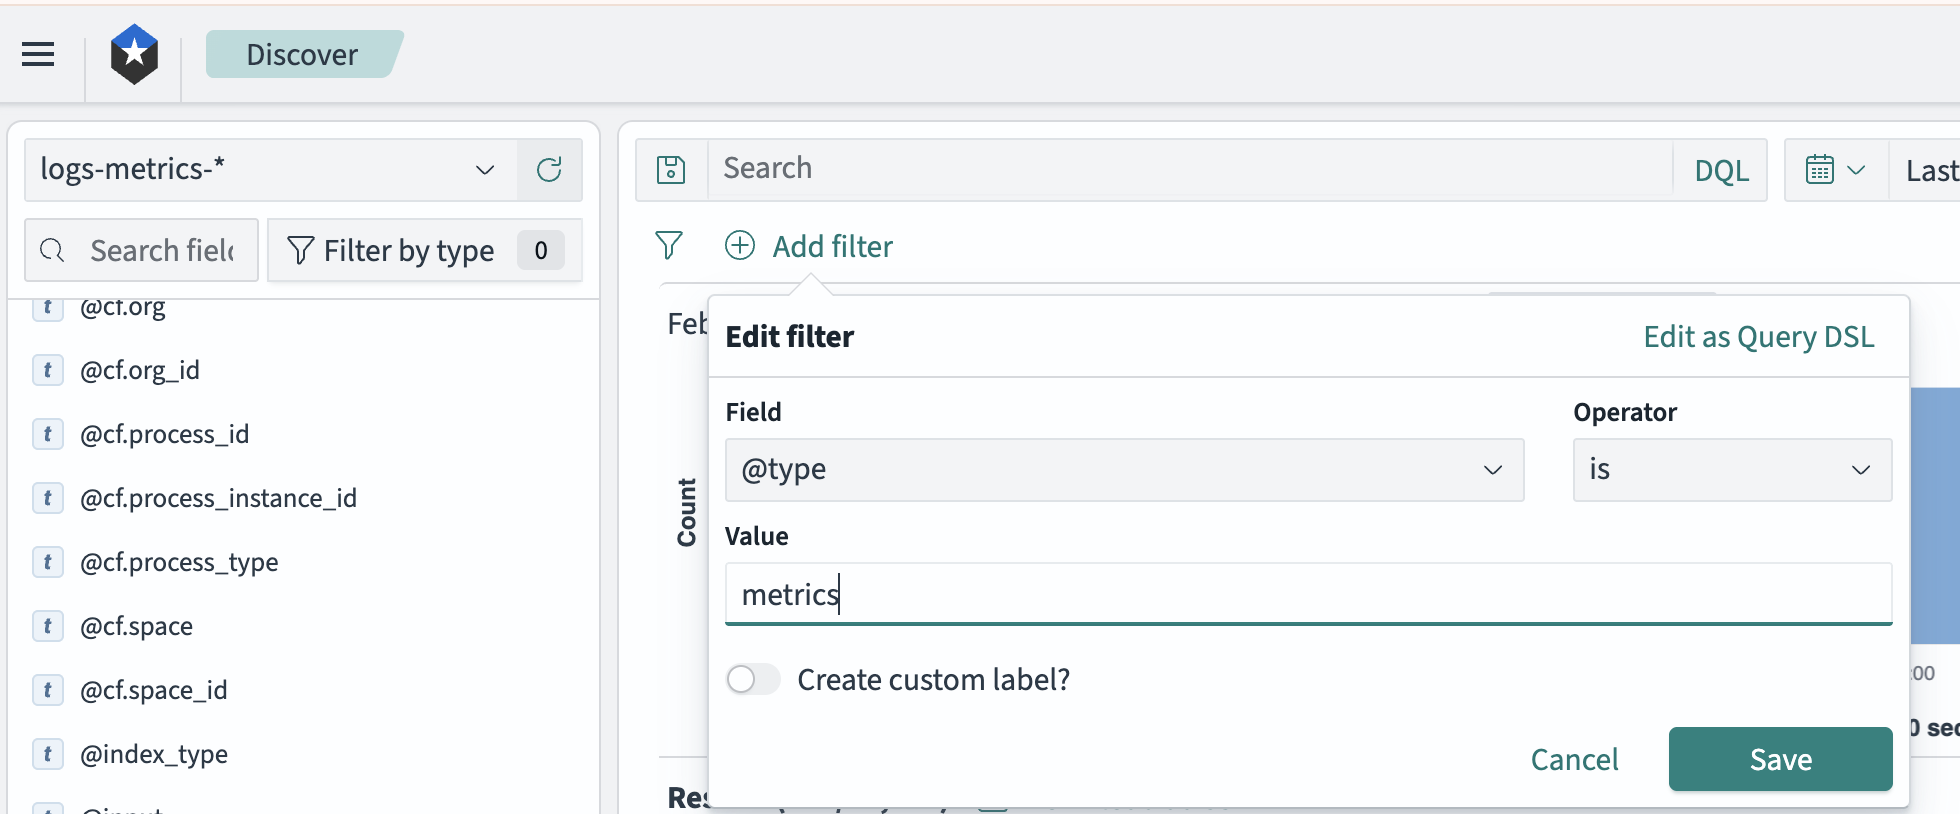
- Add a filter for
@type: metricsto your log search
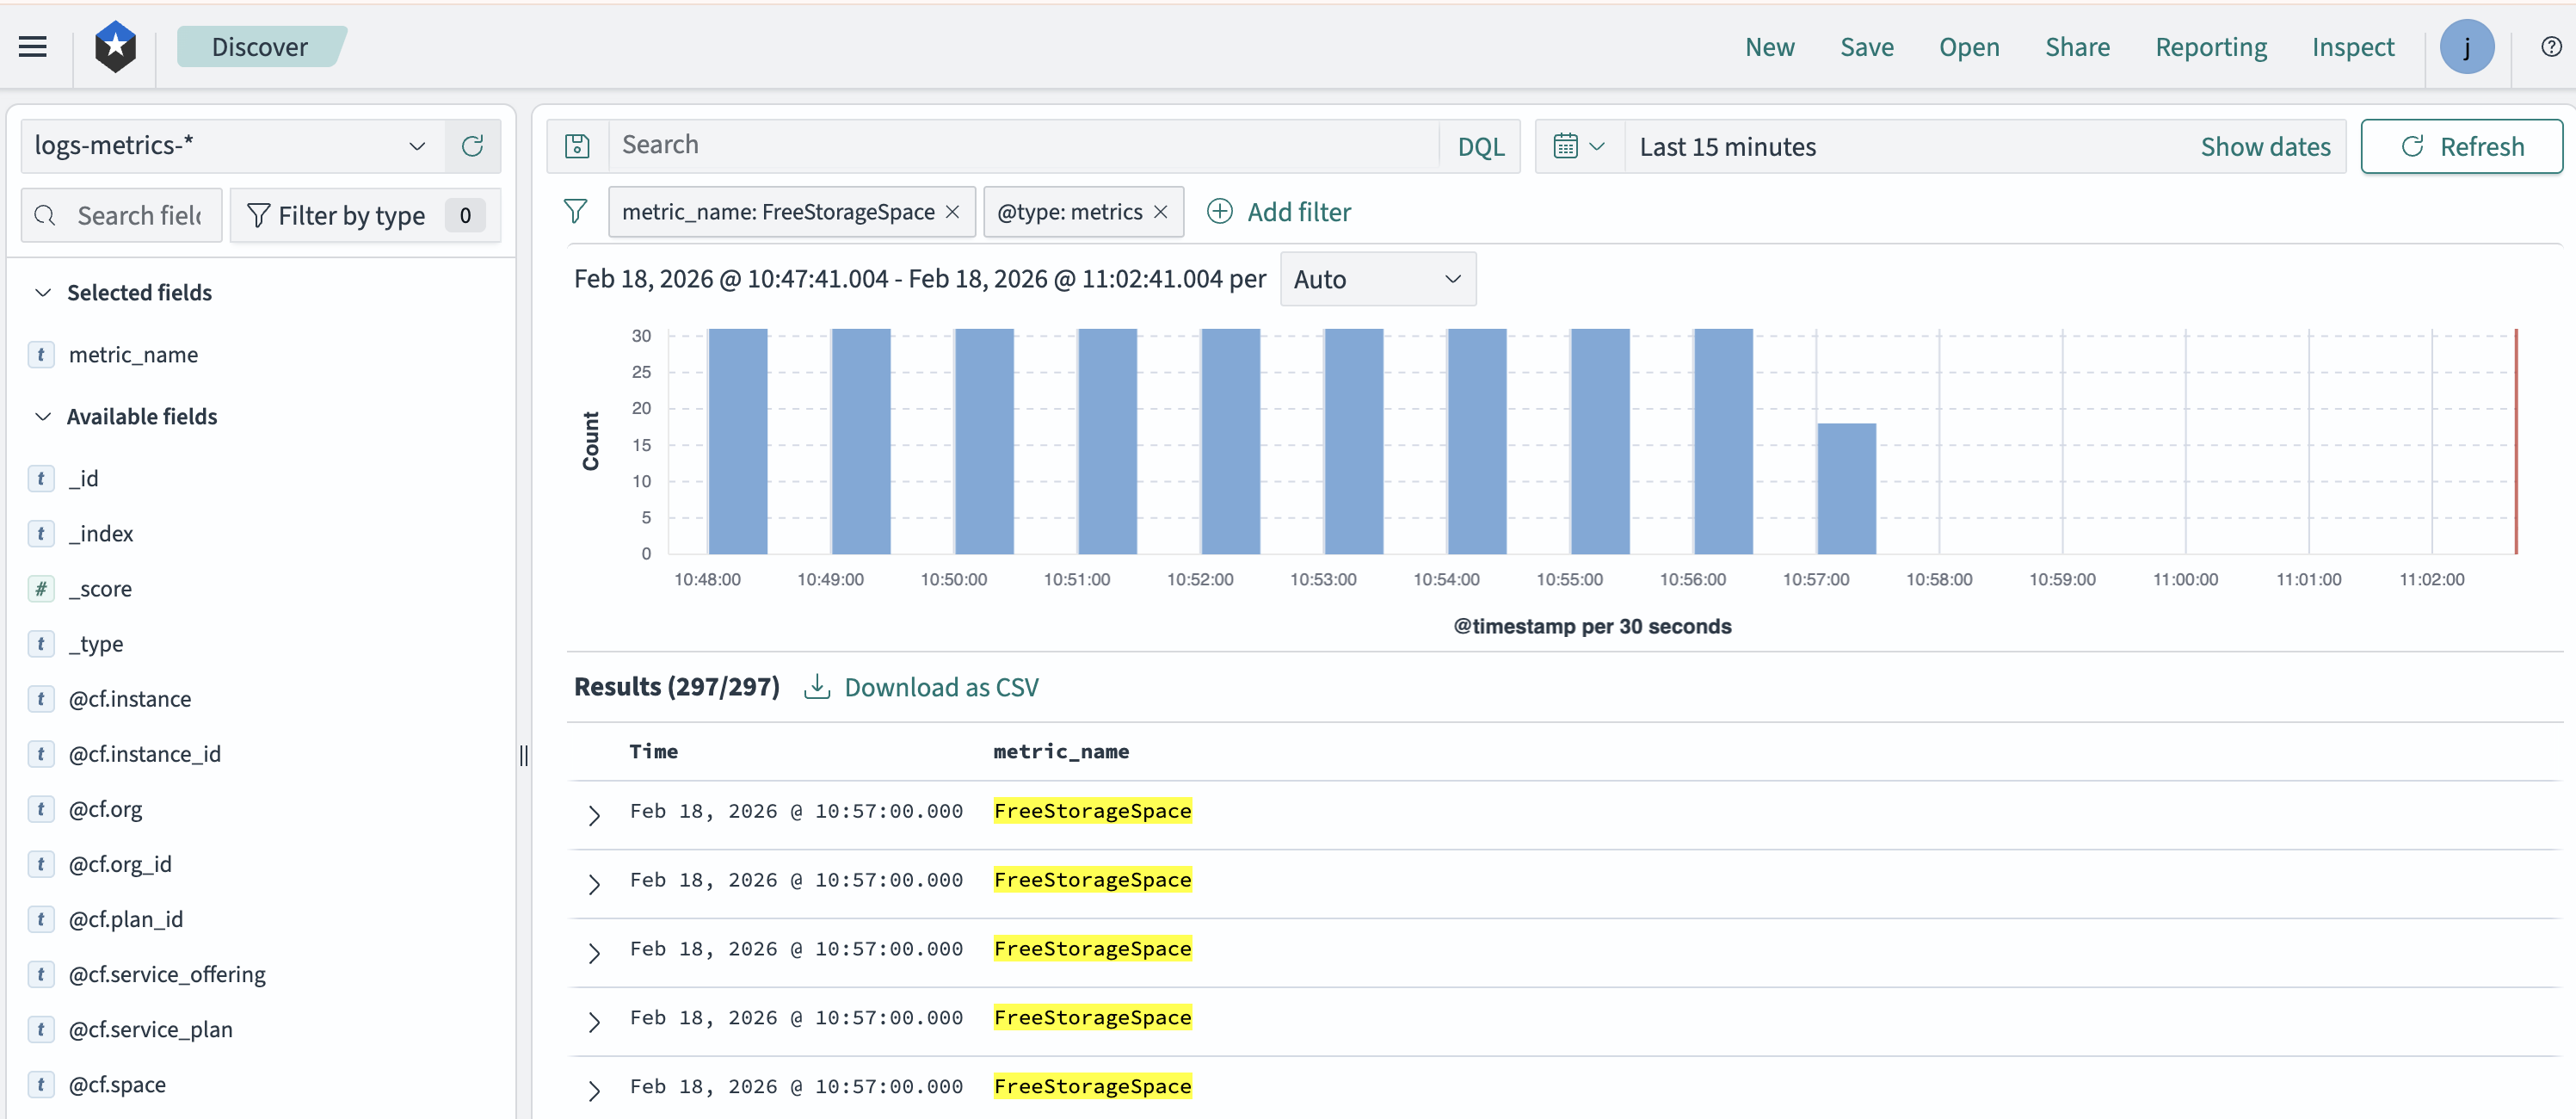
- Apply additional filters on the metrics event fields as desired. For example, to filter for domain FreeStorageSpace, add a filter of
metric_name: FreeStorageSpace:
Metrics Fields
The fields available on metrics records are:
@cf.service_offering- Type of service being monitored@cf.service_plan- Specific service plan detailsmetric.average- Numeric value of the metricmetric_name- Name of the specific metricmetric.unit- Unit of measurement
How Metrics Are Ingested into the Logging System
An automated job runs every 10 minutes to pull metric events from the platform and ingest them into the logging system. AWS limits most metrics to a 2-minute delay. Thus, there could be up to a 12-minute delay before metric logs appear in the logging system.
Retention
Metric events are retained in the logging system for 3 months and in offline storage for 30 months.