
Now available: Alerting for Cloud.gov logs
Alerting is now available for Cloud.gov Logs. This new feature allows users to monitor their logs and receive email alerts when certain conditions or thresholds are met.
How you can use alerts
You can use the alerting feature of Cloud.gov Logs to be alerted based on:
- The count of documents returned by a query for the given time period
- The average, sum, maximum, or minimum value of a field value for the given time period
For example, you can receive alerts when:
- There are elevated 404 response rates for your application
- Specific terms or phrases (e.g. errors, exceptions) appear in your logs
- Your database storage has reached a certain percentage
Documentation
For information on how to configure log-based alerts, please visit the Alerting page in the Observability section of this website.
Example 1: Alerting on high disk usage for an RDS database
To receive alerts when the percentage of storage used by an RDS database service exceeds a certain threshold (e.g. 85%):
-
Set up the notifications to configure what emails will receive alerts
-
Open the OpenSearch navigation menu, then select Alerting under OpenSearch Plugins
-
Click the Monitors link in the tabbed navigation near the top of the page
-
Click the Create monitor button near the top right of the page
-
On the Create monitor page, enter the following information in the Monitor details section:
- Monitor name: Any descriptive name for this monitor (e.g. "MonitorHighRDSDiskUsage")
- Monitor type: Per query monitor
- Monitor defining method: Extraction query editor
- Schedule: 1 hour
-
In the Select data section, enter the following details:
- Indexes:
logs-metrics* - Time Field:
@timestamp
- Indexes:
-
In the Query section, enter this query in the Define extraction query box, replacing
<your-instance-name>with the name of the database service whose disk usage you want to monitor:{
"size": 1,
"query": {
"bool": {
"filter": [
{
"match_phrase": {
"@cf.service_offering": {
"query": "aws-rds",
"slop": 0,
"zero_terms_query": "NONE",
"boost": 1
}
}
},
{
"match_phrase": {
"metric_name": {
"query": "FreeStorageSpace",
"slop": 0,
"zero_terms_query": "NONE",
"boost": 1
}
}
},
{
"match_phrase": {
"@cf.instance": {
"query": "<your-instance-name>",
"slop": 0,
"zero_terms_query": "NONE",
"boost": 1
}
}
},
{
"range": {
"@timestamp": {
"gte": "now-15m",
"lte": "now",
"include_lower": true,
"include_upper": true,
"format": "strict_date_optional_time"
}
}
}
]
}
},
"sort": [
{
"@timestamp": {
"order": "desc",
"unmapped_type": "boolean"
}
}
]
} -
In the Triggers section, click the Add trigger button
-
Under New trigger, enter the following information:
-
Trigger name: A descriptive name for the trigger
-
Severity level: Choose the severity level you want assigned to these alerts. The severity level can be included in the alert messages.
-
Trigger condition: Define a condition for the disk usage percentage that should trigger an alert, which is set to 85% in this example:
text ctx.results[0].hits.hits[0]._source.metric.usage_percentage > 85
-
-
Optionally, click the Preview condition response to see whether your condition would be triggered based on the current query results
-
Under Actions (1), customize the Notification details:
- Action name: A descriptive name for this action (e.g. "EmailHighDiskUsageAlert")
- Channels: Select the channel that you previously created for send emails to the desired recipients
- Message subject: A custom message subject for the alert email
- Message: The alert email contents
To preview the alert email contents, you can click the Preview message checkbox which will generate a preview of the email directly below the Message box. Youcan also click the Send test message to actually send a test version of the message to the configure channel.
-
Click the Create button at the bottom of the page.
This monitor should send an email alert if and when the disk usage of your database instance exceeds 85%. If you expect alerts that you are not receiving, then search the RDS database metric logs to determine whether your database disk usage is exceeding the configured threshold.
Example 2: Alerting on SSH access to your applications
To receive alerts whenever cf ssh is used to access one of your applications:
-
Set up the notifications to configure what emails will receive alerts
-
Open the OpenSearch navigation menu, then select Alerting under OpenSearch Plugins
-
Click the Monitors link in the tabbed navigation near the top of the page
-
Click the Create monitor button near the top right of the page
-
On the Create monitor page, enter the following information in the Monitor details section:
- Monitor name: Any descriptive name for this monitor (e.g. "MonitorApplicationSSHAccess")
- Monitor type: Per query monitor
- Monitor defining method: Visual editor
- Schedule: 30 minutes
-
In the Select data section, enter the following details:
- Indexes:
logs-app* - Time Field:
@timestamp
- Indexes:
-
In the Query section, customize the settings as shown:
- Metrics: COUNT OF documents
- Time range for the last: 30 minutes
- Data filter
@type: audit_eventtype: audit.app.ssh-authorized@cf.org: <your-org>- Replace
<your-org>with the organization you want to monitor.
- Replace
@cf.space: <your-space>- Replace
<your-space>with the space you want to monitor.
- Replace
target.name: <your-app>- Optional, if you want to monitor for SSH access to a specific application
Query configuration screenshot: 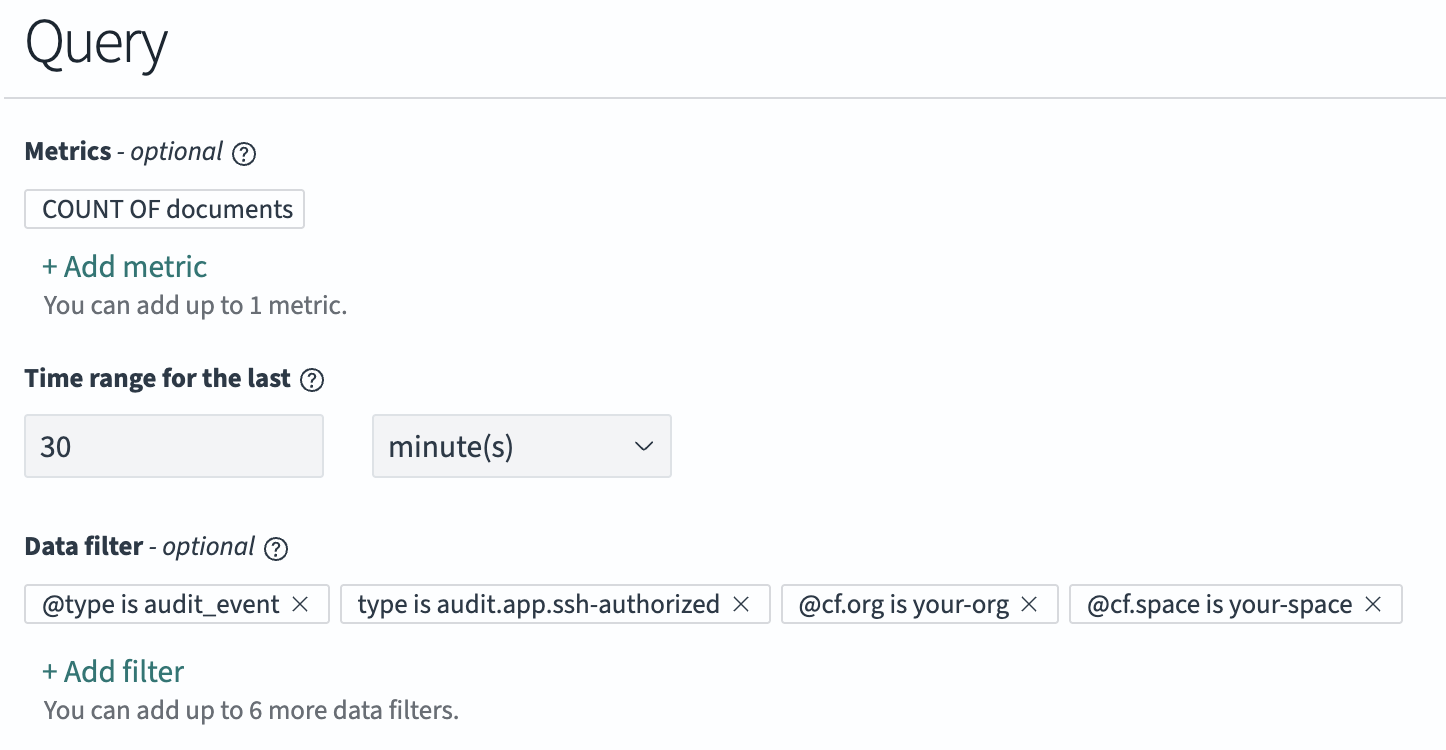
-
In the Triggers section, click the Add trigger button
-
Under New trigger, enter the following information:
- Trigger name: A descriptive name for the trigger
- Severity level: Choose the severity level you want assigned to these alerts. The severity level can be included in the alert messages.
- Trigger condition:
IS ABOVE 0
The graph below Trigger condition will show whether your monitor would have triggered in the last query period specified by the monitor, which can be useful for validating your trigger condition.
-
Under Actions (1), customize the Notification details:
- Action name: A descriptive name for this action (e.g. "ApplicationSSHAlert")
- Channels: Select the channel that you previously created for send emails to the desired recipients
- Message subject: A custom message subject for the alert email
- Message: The alert email contents
To preview the alert email contents, you can click the Preview message checkbox which will generate a preview of the email directly below the Message box. Youcan also click the Send test message to actually send a test version of the message to the configure channel.
-
Click the Create button at the bottom of the page.
This monitor should send an email alert if cf ssh is used in the organization
and space that you configured anytime in a 30 minute period. If you expect
alerts that you are not receiving, then search the
audit event logs to see if there
are SSH events meeting your monitoring condition.