
Search your logs and metrics
You can search, filter, and visualize logs and metrics from Cloud.gov Logs through OpenSearch Dashboards.
How to search logs and metrics
-
Log in to Cloud.gov Logs
-
Select the correct tenant (your organization) when prompted
-
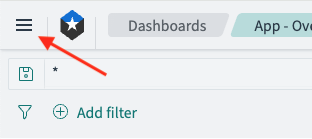
From the main navigation, click ☰ → OpenSearch Dashboards → Discover
-
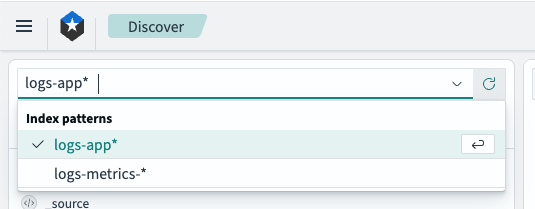
On the Discover page, choose the index pattern for what you want to search:
logs-app*contains all available logslogs-metrics*contains all available metrics
-
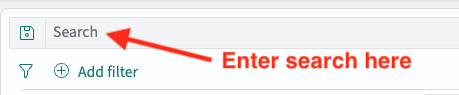
Optionally, enter a search in the search bar. By default, the search bar supports queries using Dashboards Query Language (DQL). Hit "Enter" on your keyboard to apply your search query.
-
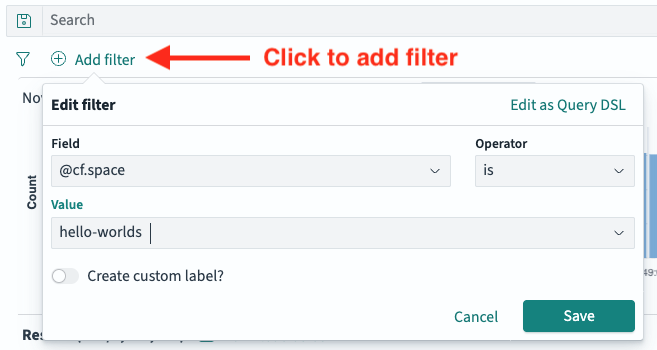
Optionally, add filter(s) to constrain the results of your search. Click the Save button to apply your filter
-
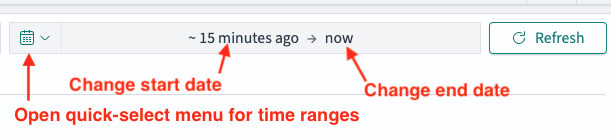
Optionally, adjust the timeframe for your search
-
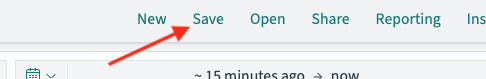
To save your search and access it again later, click the Save link near the top right of the page. In the modal window that appears, enter a descriptive name for your search for easy reference later.
Creating field-based visualizations
-
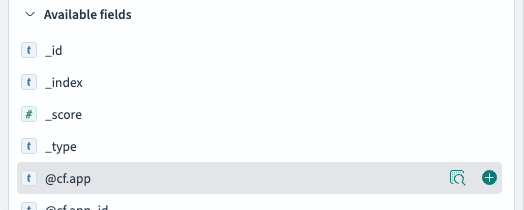
From the Discover page, hover your cursor over any field under the Available fields heading
-
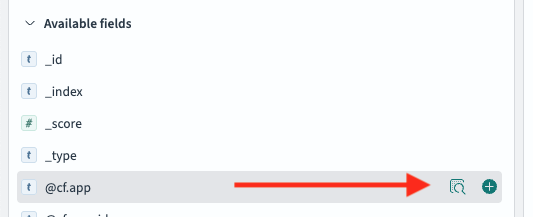
Click the icon that looks like a magnifying glass over a box
-
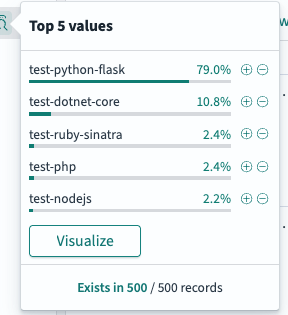
A pop-up will appear summarizing the top 5 values for the field. Click the Visualize button, which will open a page for creating a new visualization based on the field values
-
Customize the visualization as desired and click the Save button to save it

Tips for advanced queries
-
Combine multiple filters:
@level: ERROR AND @cf.org: my-agency -
Use wildcards (
*) to match similar values:@cf.app: myapp-* -
Save searches to reuse filters or share with teammates in the same tenant.
-
Export results to CSV for offline review or ingestion into your agency SIEM. (Verify export storage complies with M-21-31 and agency policy.)