
Dashboards
Cloud.gov Logs includes dashboards which provide interactive, visual summaries of application performance, platform metrics, and audit events.
These dashboards are powered by OpenSearch Dashboards, a FedRAMP-authorized analytics interface within Cloud.gov’s boundary.
Built-in dashboards
Cloud.gov Logs includes the following dashboards by default:
| Dashboard | Description |
|---|---|
| App – Errors | Summarizes application logs containing @level: ERROR. |
| App – Logs | Displays top 10 apps by log volume and log counts by severity. |
| App – Metrics | Visualizes application metrics such as CPU and memory usage. |
| App – Overview | Basic health overview for deployed apps. |
| App – Performance | Shows request metrics from router (RTR) logs. |
| Audit – Overview | Aggregates audit event logs by event type. |
| Service Logs – Elasticsearch/OpenSearch | Shows brokered OpenSearch domain logs by log stream. |
| Service Logs – RDS | Shows brokered database logs by log stream. |
| Services – ElasticCache | Monitors ElastiCache cluster metrics. |
| Services – OpenSearch / Elasticsearch | Shows brokered OpenSearch metrics. |
| Services – RDS | Monitors RDS database metrics. |
| Services – S3 | Tracks S3 bucket metrics. |
The Service Logs dashboards display logs forwarded from brokered services. Brokered service logs must be enabled on the service instance before they will appear on the dashboard. For guidance on how to enable brokered service logs:
How to browse dashboards
-
Log in to Cloud.gov Logs.
-
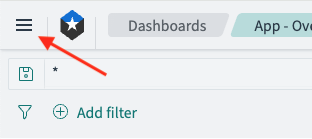
Click the ☰ (hamburger menu) icon at the top left.
-
Under OpenSearch Dashboards, select Dashboards.
-
Browse available dashboards. The name of the built-in dashboards identifies what types of logs or metrics are included in them (eg.
App,Audit,Services).
Create your own dashboards
Consult the OpenSearch documentation on how to create your own dashboards.